WALTHAM™ Puppy Growth Charts
How big will my puppy get? When will my puppy stop growing? How much weight should my puppy be gaining? Like many new puppy owners, you might be asking yourself all these questions – and more. Owning a new puppy can be a challenge. And if shark teeth and chewed slippers weren’t enough to deal with, healthy weight gain should also be a concern.
Created by a group of experts including veterinarians, statisticians, and nutrition scientists, WALTHAM™ Puppy Growth Charts can help pet owners and veterinary professionals monitor dogs’ growth.
Why should I use them?
Just like babies, puppies that grow too quickly or slowly can suffer from lifelong health problems. Science has shown that healthy weight for life starts with healthy growth as puppies. Puppies that grow too fast are at risk of developing health problems including obesity, and those growing too slowly may have underlying healthy conditions– therefore it’s important that puppies grow at a healthy pace.
But getting a good estimate of your puppy’s ideal weight and how much weight they should be gaining can be difficult. This is because several factors can influence the growth rate of each individual puppy, including their breed or size, sex, neutering, illness, diet, and the environment they live in.
Did you know dogs of different sizes grow at different rates? A toy (under 9kg) dog reaches adulthood in 1 year, but a giant breed (over 40kg) takes nearly 2! Your dog’s sex matters too, as males typically grow faster than females.
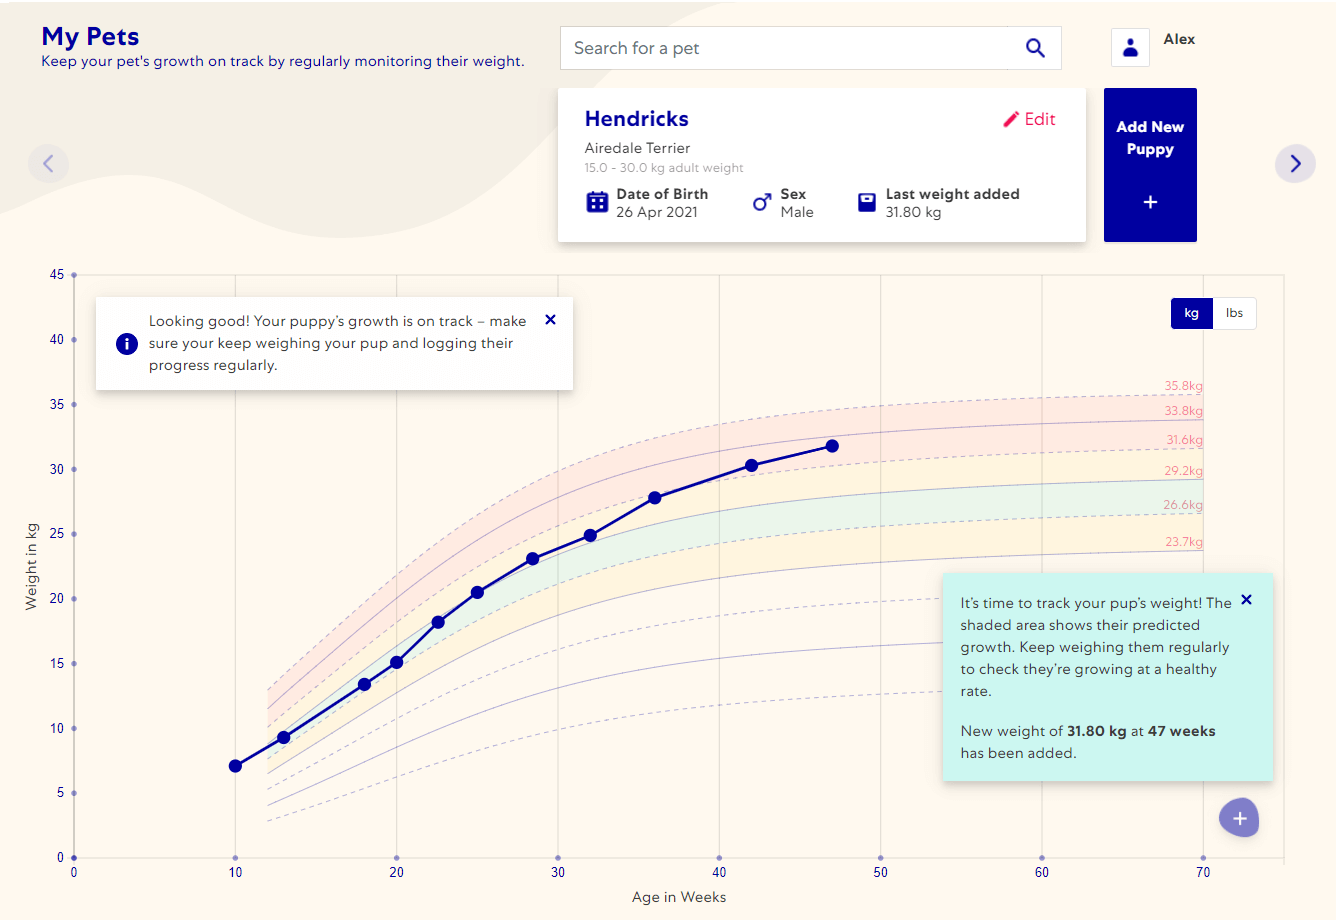
By using the charts, you can compare your puppy’s weight and growth to the weight of other healthy puppies of a similar size and at the same age. This allows you to track if they’re following a healthy growth pattern or spot any unusual growth so you can reach out to your veterinarian before it becomes an issue.
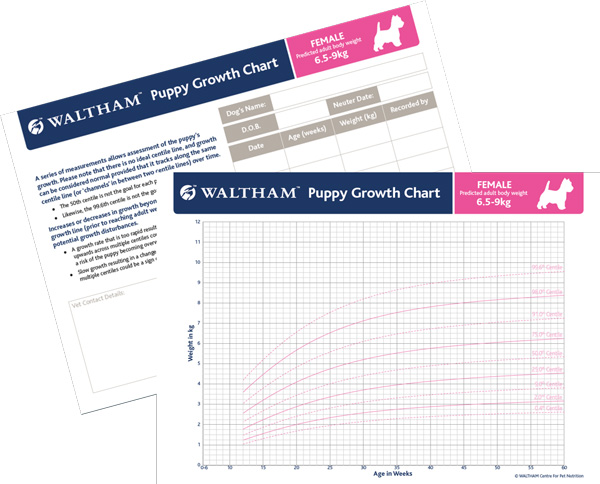
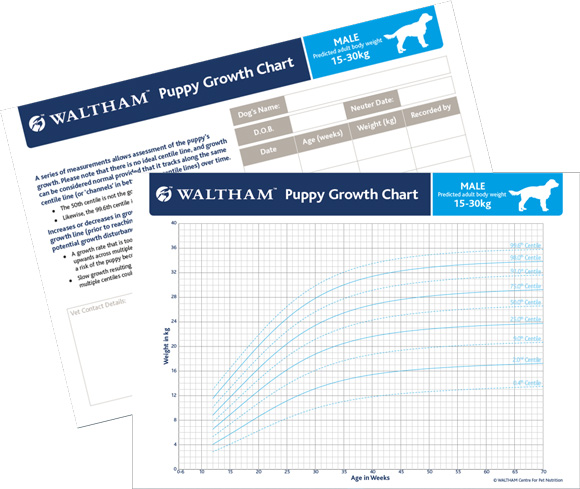
Because dogs of different sizes grow at different rates, there are 10 different charts for male and female dogs up to 40kg, tracking their growth from 12 weeks old to adulthood. The charts are based on data from 50,000 healthy young dogs and are intended to be a standard for healthy growth. They have been scientifically developed in a similar manner to charts that healthcare professionals around the world use to monitor the growth of children (e.g. the WHO growth standards).
Sign up in the app below to start tracking your puppy’s growth and get access to:
- Free of charge growth charts, scientifically developed by vets and scientists using data from 50,000 healthy dogs
- Alerts if your puppy isn't growing as expected
- Your puppy’s ideal adult weight
- 10 different growth charts across five size groups,for male and female dogs up to 40kg (adult weight)
- Suitable for pure and mixed breed dogs
- Create unlimited pet profiles
- Shareable growth charts that you can discuss with your veterinarian or post on social media
WALTHAM™ Puppy Growth Charts FAQs
Puppies grow very quickly in their first few months, so their date of birth is important in tracking their growth accurately. A difference of a week or two could make a big impact as to how their growth is interpreted. If you don’t know your puppy’s birthday, you could check with the breeder or if you got your puppy from a shelter, your veterinarian may be able to estimate their age. If you use an estimated date of birth, follow the curves with caution and speak to your vet if you have concerns if your puppy’s growth appears to be going off track.
Yes! If your puppy’s breed mix does not appear in the drop-down list, please select the 'mixed breed' button'.
See also: I don't know how big my puppy will grow. What size option do I select?You can start tracking your puppy’s growth as soon as they join your family. However, the Growth Charts are only validated for the growth curves from 12 weeks old. This means that any bodyweights you add before this will be plotted but growth lines won’t appear until you’ve added two weights, 2 weeks apart, after your pup reaches 12 weeks.
See also: My puppy’s already over 12 weeks old. Can I still track their growth?Of course you can! If your puppy is already over 12 weeks old - don't worry. Our charts are most accurate when you start recording as early as possible, when your puppy is between 12 and 20 weeks old, as this is when they will experience their most rapid period of growth. If you start tracking after this period you will still be able to monitor your puppy's growth, it's just that it's trickier to say that your puppy's growth is on track.
Oops – having trouble receiving the passcode? Please check your spam folder.
If it is not here, we may be having a problem verifying this email domain. Please try a different email address. If you are still having problems, please contact us.
The healthy growth rate of a puppy is linked to how big they will grow. Small dogs will grow more quickly and reach adult size much quicker than large dogs. This means that information about your puppy’s adult weight is important to choosing the correct chart and tracking their growth.
There are several ways that can help you decide which estimated adult weight to pick. Don't worry about getting it wrong. If you haven’t selected the best chart, you'll be able to swap to a different one later.
- If you know your dog's breed, you could check their estimated adult weight and use this to guide you.
- For cross or mixed breeds, if you know the breed or the weight of their parents, you may be able to estimate your pup's adult weight
- If your dog is an unknown mixed breed, you could use WISDOM PANEL™ DNA genetic test to find out what their parents most likely were, and much more.
- Your vet may be able suggest what weight they may reach
There are a couple of different ways to help guide your selection. For example, if you know what your dogs' parents weighed, you may be able to estimate your pup's adult weight. Or perhaps if you puppy’s breeder is experienced with the breed or cross, they may be able to advise if your puppy is larger or smaller than a typical puppy in their experience.
However, if these options are unable to guide your choice, your pup’s parents’ weights also cross two weight categories, or their parents were an unhealthy weight, you may need to start by guessing your pup's estimated adult weight. You can change the chart in future if needed.
If you've selected the best weight category and the puppy is growing healthily, it's likely the weights will be following the curves. If your puppy may be best suited to a different weight chart category, the digital tool with notify you after you’ve plotted several weights to suggest trying a different weight chart.
Unfortunately, we don’t have growth charts for giant breeds yet! This is because different giant breeds exhibit different growth patterns, so it wasn’t possible to create a single chart. If you have a giant breed pup, please work closely with your veterinarian to ensure they grow at a healthy rate.
You can change the Growth Chart size range for your puppy at any time. Select the edit button next to your pet's profile. Change their estimated adult weight to the correct range and click submit to update it.
The digital Growth Charts monitor your puppy’s growth along with you. This allows you to be updated with how your puppy is growing. If your puppy isn't following a typical growth pattern for a dog in their current weight category, you may be alerted to try a different estimated adult weight size chart. For example, you may see that your puppy has weight is near to the top or bottom of the current chart crossed two or more growth curve lines. This may mean your puppy is going to be a different adult weight than what you originally selected.
Try changing your puppy's estimated adult weight either up or down depending on where they are currently tracking on the charts. Hopefully you'll find that your puppy's weight tracks better on the new chart you select! Keep tracking and if your puppy isn't following the growth curve of either the new or original chart, please speak to your veterinarian to ensure that your puppy is growing at a healthy rate.
See also: How do I change the Growth Chart for my puppy?If your puppy isn't too heavy to lift and hold, you can weigh them at home using regular digital scales. First of all, pick up your pup and record the weight of the both of you. Then weigh yourself and subtract this weight from your combined weight. This will give you the weight of your puppy.
If your pup is too heavy, or doesn't like to be held, you may need to use the scales at your local veterinary clinic. Many clinics will welcome extra visits from cuddly puppies. It is a useful opportunity for your pup to have a fun experience in their veterinary practice and your veterinary team will be pleased that you are tracking your puppy’s growth and making sure they are healthy. Check with your local vet clinic if they can weigh your puppy for free.
If your puppy is a smaller breed (under 6.5kg) you may wish to weigh them in a box or pet carrier instead of picking them up. If doing this don’t forget to subtract the weight of the carrier from the combined weight to get the actual weight of your puppy. As they’re so small, check your scales go up in small (e.g., 1 gram) increments to accurately track their growth
Top Tip: Try to use the same scales each time you weigh your puppy and don't forget to factor in how big they're going to grow! Remember to remove all any excess items such as their collar, harness or clothing.
Every 2-4 weeks, up to 6 months of age, and then every 1-3 months until fully grown
It's not encouraged to weigh your puppy more frequently as things such as toileting and meals can make your puppy's weight appear to fluctuate. Regular (e.g., every 2-4 weeks) weight measurements over a longer period are more likely to reflect the true change in weight.
If you miss the occasional measurement, don’t worry. Weigh your puppy as soon as possible and add their weight to the growth chart. If there are more than 12 weeks between recorded weights it will be harder to predict if your puppy if growing correctly, and veterinary advice may be needed to confirm they’re growing healthily.
Desktop device - In the bottom right of the growth chart there is a plus button. Click this to add a new weight.
Mobile device - Make sure you've selected 'growth chart' and click the action button below
Click on the point you want to update and change the number in the weight box. Click 'Add weight' to update the growth chart.
If the date is incorrect, you will need to delete the point and re-enter it
When adding a new puppy, you can choose between kg and lbs. You can change this later by selecting the kg/lbs toggle in the top right of the growth chart.
Sorry to hear your puppy is unwell! We recommend you continue weighing them even though they’re not feeling their best.
Some illnesses, such as gastroenteritis, can lead to a temporary halt in growth. In most cases your puppy should catch up again to the original centile line. If this doesn't happen, they're ill for a long period of time, or they cross 2 or more centile lines, please contact your vet.
Top Tip: make a note of when they were unwell in your calendar in case you need to discuss with the vet in the future
The colour areas of the chart will appear once two bodyweights have been added that are 2 weeks apart, and the first is when the puppy is 12 weeks old or over. The earliest this will appear is therefore when the puppy is 14 weeks old. Still having problems, contact us.
See also: What do the colours on the chart meanYour puppy's growth chart includes curves, which are centile lines. These represent the expected range of normal growth for dogs within that estimated adult weight category.
For the WALTHAM™ Digital Growth Charts the centile number has been replaced with the adult body weight for that curve. Growth charts with the centile numbers on are available to download in resources for veterinary professionals.
Weights that follow a curved line are considered to be ‘normal’, regardless as to whether this is the lowest or the highest growth curve. For example, a puppy’s growth can track consistently between the lowest two curves and have healthy, normal growth. Typically, a healthy puppy’s weights stay in the same part of the chart throughout growth. However, some healthy puppies track more closely to the curved lines than others.
By tracking weight and comparing them to the growth curves, problems can also be identified and managed more quickly. For example, puppies crossing growth curve (or centile) lines upwards are growing quicker than expected, whilst those crossing downwards are growing more slowly than expected. Crossing these lines can occur in healthy dogs, however it's more likely to occur when there is a health issue or problem with nutrition and may indicate that a trip to the vet is be needed.
 See also: how were the Waltham PGC and growth curve lines created?
See also: what are the curves on the PGC?
See also: how were the Waltham PGC and growth curve lines created?
See also: what are the curves on the PGC?
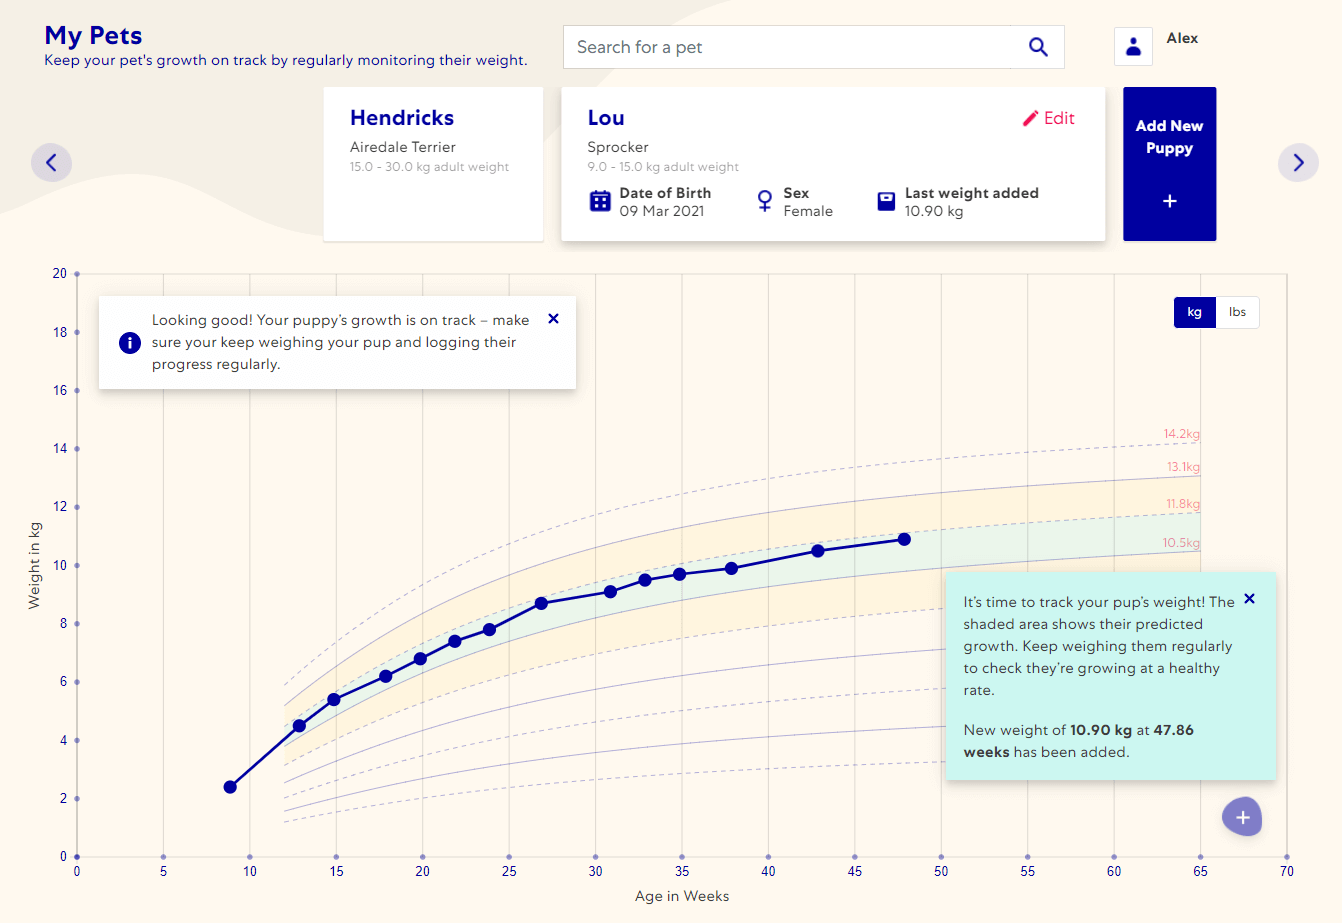
The puppy growth charts will colour different areas of the chart once enough weight measurements have been added for your puppy. The colouring is to help you understand what the expected growth trajectory is for your puppy, and when to be cautious, or seek veterinary advice.
Green zone – this is the ideal area for your puppy’s weight. This area has been selected based on 3 measurements 2 weeks apart after 12 weeks old when you started to track your puppy’s growth. If your puppy’s weight is in the green band (between two growth curves, or centiles) they are growing the same rate as other healthy puppies.
Orange zone – These areas highlight the neighbouring areas to the green, or ideal zone, for your puppy. If your puppy’s weight crosses into these areas, it means they are growing a little faster/slower than expected for healthy growth. This isn’t something to be concerned about, as it may represent healthy growth for your pet, however, keep weighing them regularly to see how their weight continues to change and track on the chart.
Red zone – This area highlights when weight measurements for your puppy are a concern. If you add new weights and they are in the red zone, check that the weight measurement is accurate and the date is correct. Keep an eye on your puppy – take another weight measurement 2 weeks later. There are notifications in the charts to let you know what action you should take. If you have any concern, please seek advice from your veterinarian.
That’s perfectly fine. Every puppy is unique, and we occasionally see bumps/dips in growth patterns. Check your puppy’s weight in 2-4 weeks’ time. If you have any concerns, seek advice from your veterinarian.
There are four distinct stages in a puppy’s development: the neonatal period; the transitional period; the socialisation period; the juvenile period. The length of the juvenile period depends on the adult size of the puppy and is followed by adulthood. Puppies don’t all grow at the same rate and depending on their size, become adults at different times. Small dog breeds (under 9kg) will be full grown in a year whereas a 30-40kg dog will be full grown in 18 months, and some giant breeds take almost two years!
Further Reading: WALTHAM™ pocket book of puppy nutrition and care Find out what your puppy needs to thrive: SHINE™ welfare framework for dogs emotional wellbeingPuppies don’t all grow at the same rate and depending on their size, become adults at different times. Extra small dog breeds (under 9kg) will be full grown in a year whereas a 30-40kg dog will be full grown in 18 months, and some giant breeds take almost two years. Males and females also grow at different rates; males grow more rapidly than their female counterparts. Separate curves for male and female across different weight ranges were created to account for this difference.
When your puppy reaches the end of their growth curve, this is when they are considered fully grown.
We found the overall growth pattern is similar for entire and neutered dogs that attain a healthy adult body weight. This means that separate charts are not needed for entire or neutered dogs. However, neutering can impact growth rates.
Top Tip: Add the neuter date to your chart so you can see how if it impacts your puppy's growth.
Body condition score charts are a great way to check if your pet is in ideal condition.
With lots of variations between breeds of dogs such as conformation and coat thickness, if you haven't been trained and gained experience measuring lots of different dogs, they can be tricky to use and may result in a dog being scored incorrectly. Body condition scoring can also be unreliable in puppies and young dogs.
The WALTHAM™ Puppy Growth Charts can be used by anyone without training and help owners track if their puppy is gaining a healthy amount of weight.
Top tip: when you take your dog to the veterinarian ask them to body condition score your dog (and explain why they have given that score) so you get used to what your dog feels like at a healthy weight.
Once you have taken 3 measurements 2 weeks apart after 12 weeks old so that you know the growth curve line that your puppy is following, you could then use this to predict expected adult weight, assuming that the puppy continues to grow at a healthy rate.
Your puppy should reach adulthood in the ideal or green zone of their growth chart. This bodyweight should be healthy for your pet. Make sure you keep monitoring their weight as this should not fluctuate too much. If it changes by more than 5% seek veterinary advice.
The charts are based on data from 50,000 healthy young dogs and are intended to be a standard for healthy growth. These dogs had their bodyweight recorded during routine trips to one of the Banfield Pet Hospitals in the USA. They all remained healthy and in ideal body condition during their first 3 years. Once developed, the charts were validated by comparing the growth curves to the growth pattern of other healthy dogs and dogs that were overweight, or underweight or had diseases associated with abnormal growth.
The methods behind the creation and validation of the Puppy Growth Charts have been published in PLoS One, an independent international, peer-reviewed scientific journal. They were created by a group of experts including veterinarians, statisticians, and nutrition scientists. The scientific approach to develop these charts is similar to the one used to monitor the growth of children (e.g. the WHO growth standards), which are used by healthcare professionals around the world.
A large number of growth curves were first created which allowed the development of curves for five “size categories” for dogs based on predicted adult bodyweight. These growth curves (or centile lines) were then validated by comparing the pattern of growth depicted with growth patterns in different populations of healthy dogs, dogs with abnormal body condition (underweight, overweight, and obese), and dogs diagnosed with conditions associated with accelerated or retarded growth.
See Also: How Growth Charts can help puppies stay healthy See Also: What are the curves on the Puppy Growth Charts See Also: The science behind the Puppy Growth Charts See also: Validation of the Puppy Growth ChartsThe nine curves displayed on each growth chart are also known as centile lines. The 50th centile indicates the weight at which 50% of the dogs in this size category (and of the same sex) are lighter. The growth charts have been created with the following centile lines: 0.4th, 2nd, 9th, 25th, 50th, 75th, 91.0st, 98.0th and 99.6th. The number of the centile reflects the percentage of the population whose weight falls below that line; for example, if a dog is on the 75th centile, it means than 75% of dogs in that population group will weigh less (and 25% will weigh more).
These are indicated on the PDF versions of the charts. For the digital growth charts, we have replaced these centile values with the adult bodyweight for that growth curve line.
Any growth pattern that follows a centile line, or space between two centile lines, can be considered a healthy. The most important thing is that the puppy doesn’t cross two centile lines.
Our puppy growth charts are designed to track healthy growth, but when you’ve taken 3 measurements 2 weeks apart after 12 weeks old so that you know the growth curve line that your puppy is following you may be able to use it as a puppy weight or size calculator. This accuracy of this relies on your puppy continues to follow the curve by growing at a healthy rate.
Yes! We have added the WALTHAM™ Kitten Growth Charts into the App. Select “Kitten” when adding your pet.
More info on the Kitten Growth ChartsWe'd love to hear from you! Please email us via the contact us form and select 'our institute' as the option.
Resources for veterinary professionals
With unlimited pet profiles, veterinary teams can create their own account to add puppies or encourage pet owners to sign up and track their own pet’s progress.
PDF copies of the charts are still available below. These can be downloaded, printed, and used to track a puppy’s growth. WALTHAM™ Kitten Growth Charts are also available as PDFs.
Using WALTHAM™ Puppy Growth Charts, veterinary professionals can:
- Reassure owners on their puppy’s diet and how much to feed
- Identify puppies that are growing too quickly and are at risk of becoming overweight
- Identify puppies that are growing too slowly and may be under-fed or a suffering from a growth disorder
- Recommend changes to a puppy’s nutrition plan e.g., increasing or decreasing food if a puppy is growing too slowly or too quickly
- Justify recommending further investigations if a disorder of growth is suspected
Below you can find a range of documents designed to support veterinary professionals using pet growth charts in their clinics.
Please note we have chosen to provide our charts only in a digital format and are unable to provide physical copies of any parts of the growth chart kits. If you need to calculate age, we recommend using an online calendar.